 Power Analytics
What You Can Unlock with Power Analytics
From identifying at‑risk customers and maximizing appointment value, to tracking employee productivity and store performance — everything becomes visible and actionable.
Customers, Appointments & Cancellations
Track how your customer base engages with your services over time. Understand not just how many book appointments, but also how often they cancel — and when.
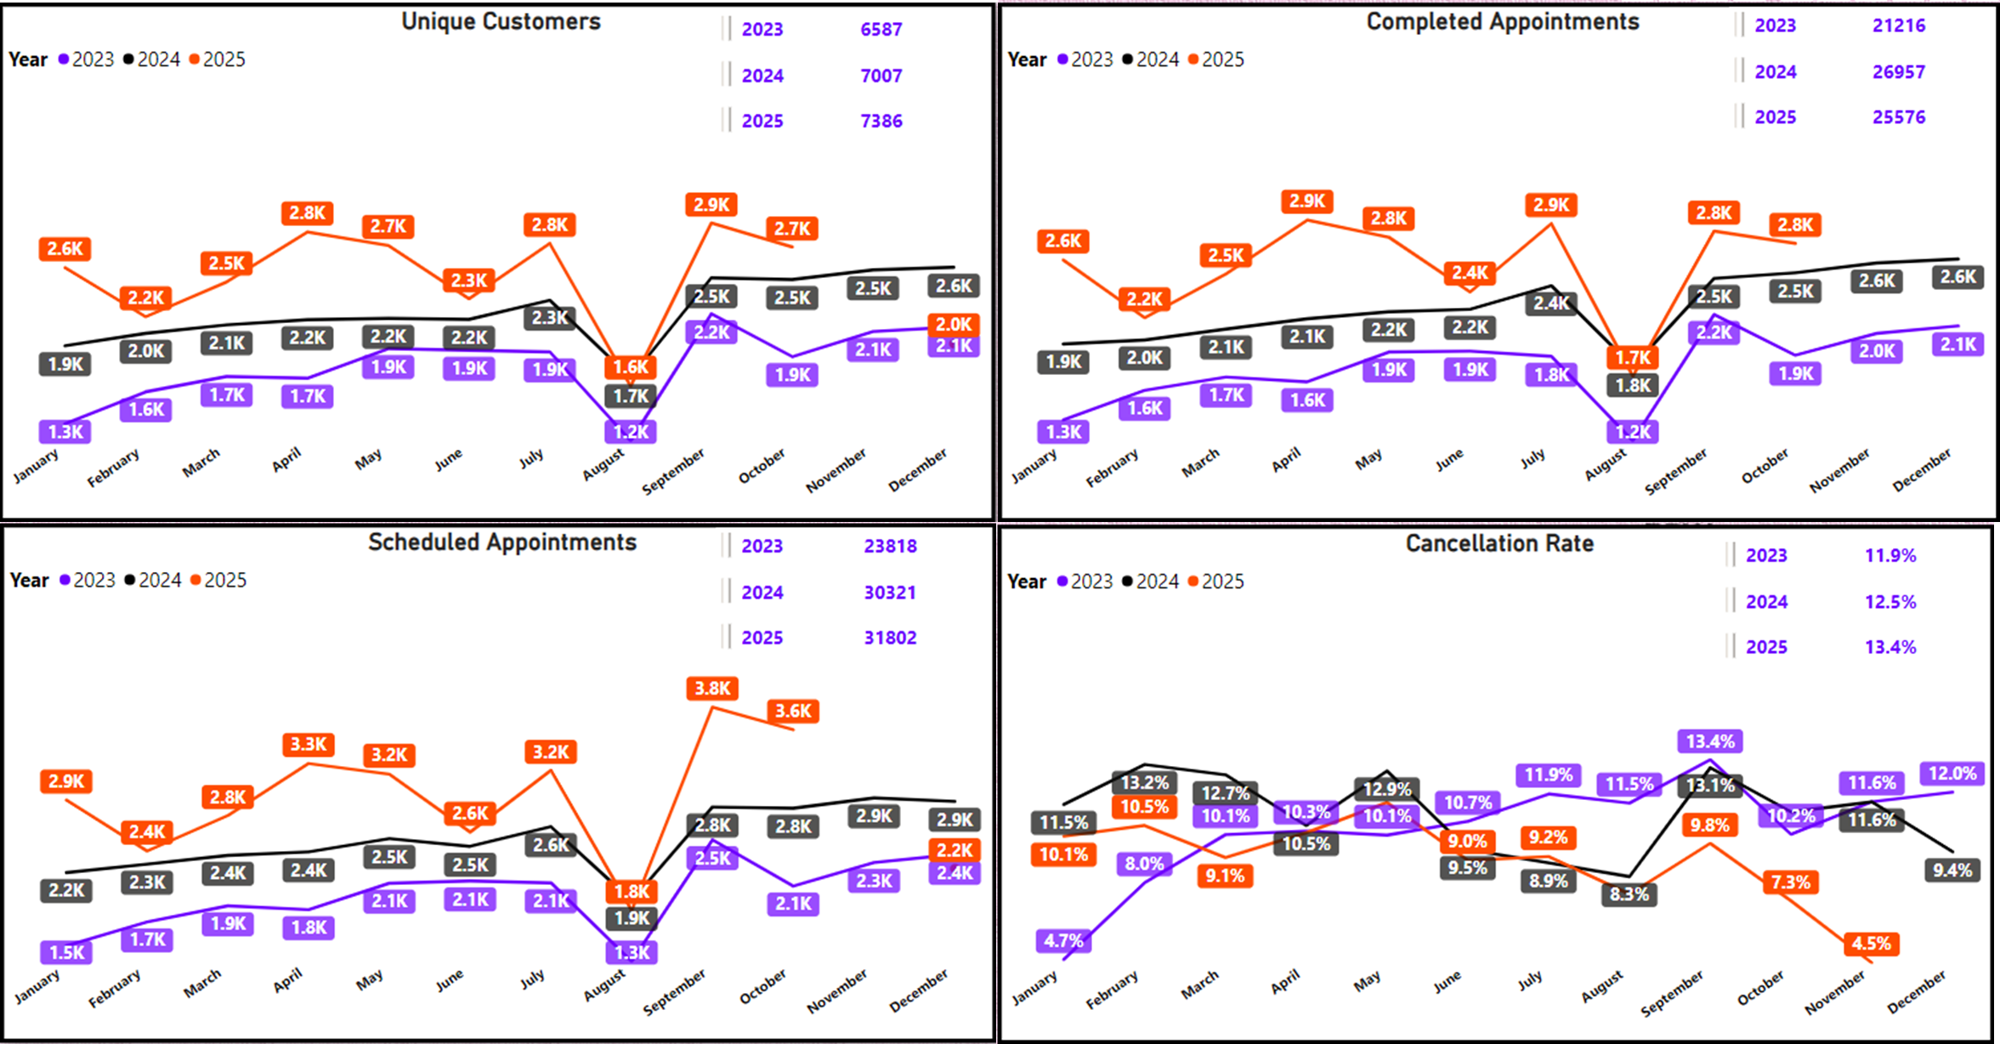
- Unique customers per month and annually
- Scheduled appointments by customers per month and annually
- Cancellation rate per month and annually
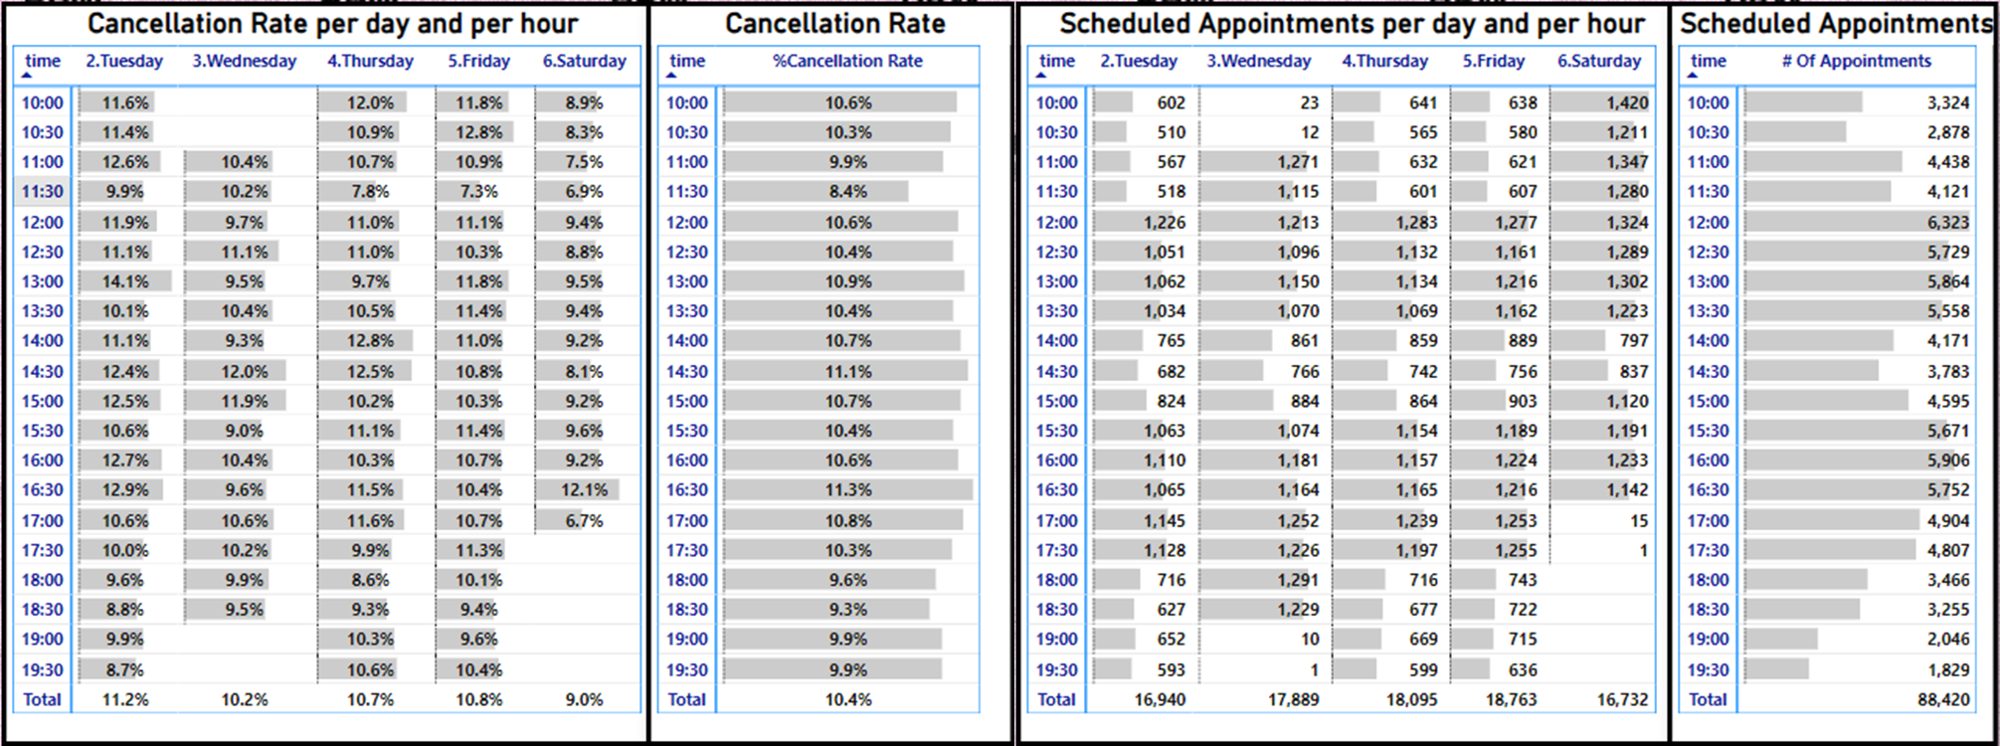
- Cancellation rate by weekday and time interval
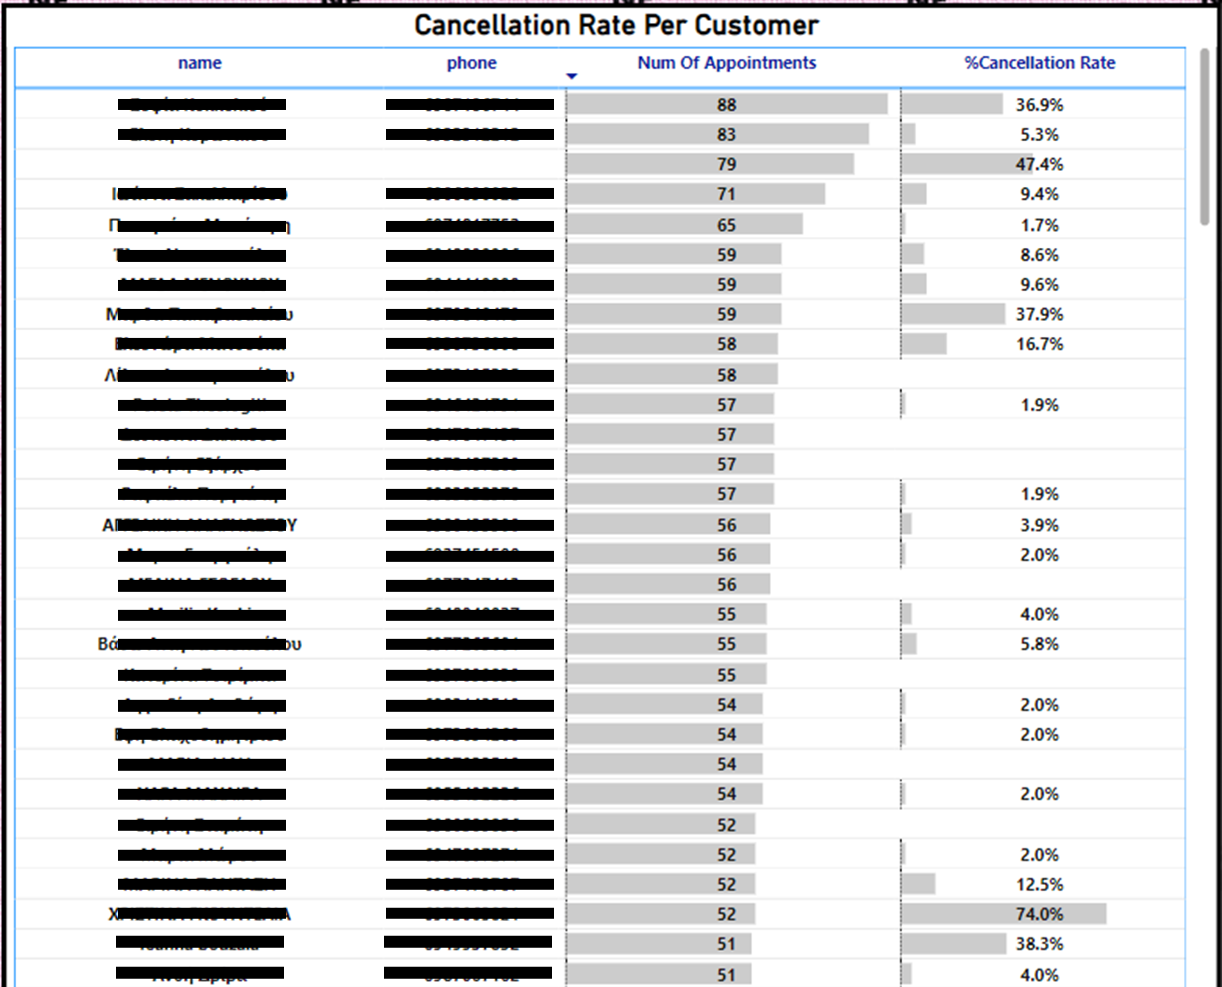
- Appointments and cancellations per customer
Revenue & Performance Insights
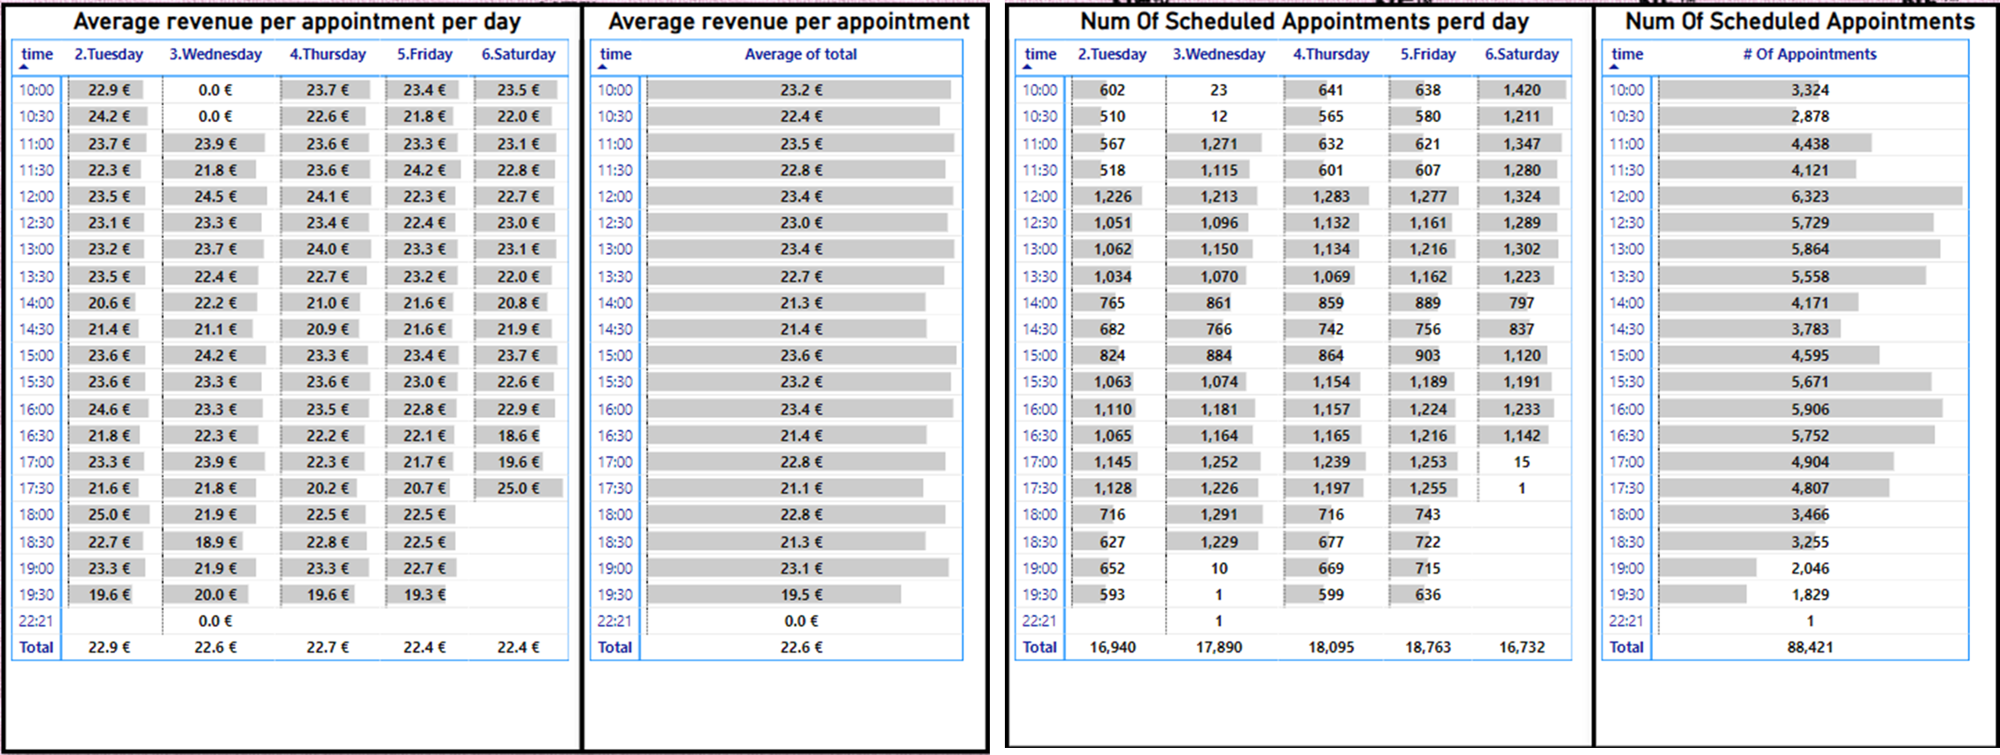
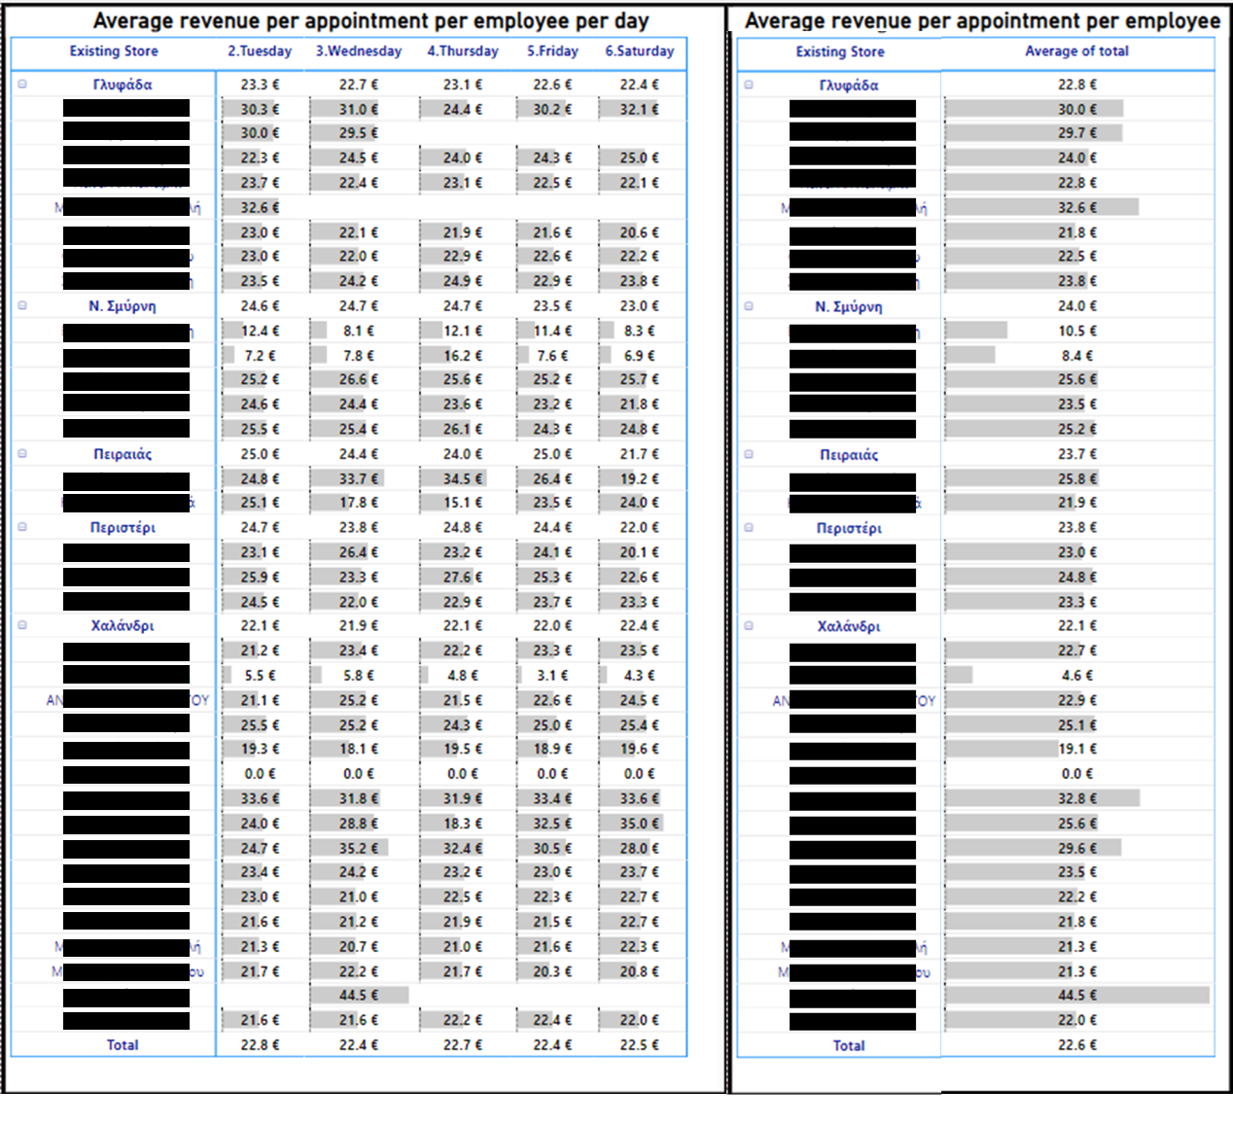
Analyze how your revenue is generated — across time, stores, employees, and even individual customers. Discover which hours, days, stores, and people drive your business most.
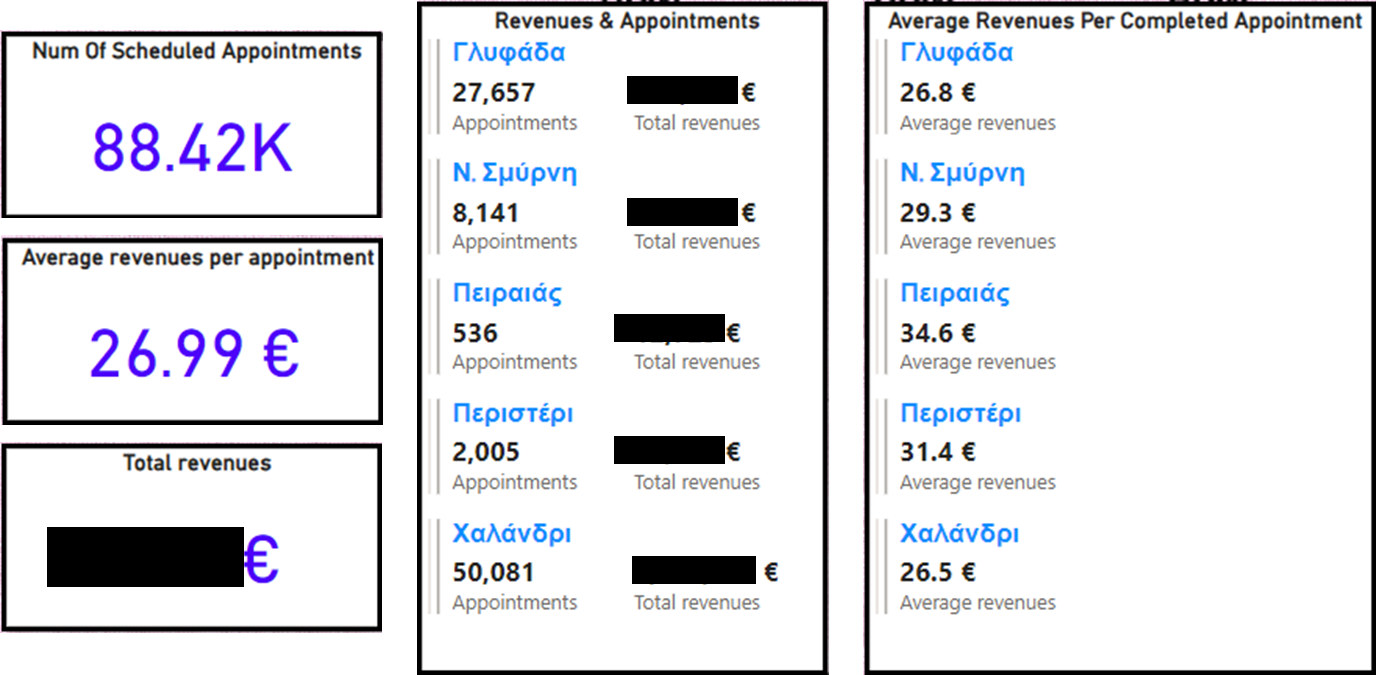
- Total number of appointments
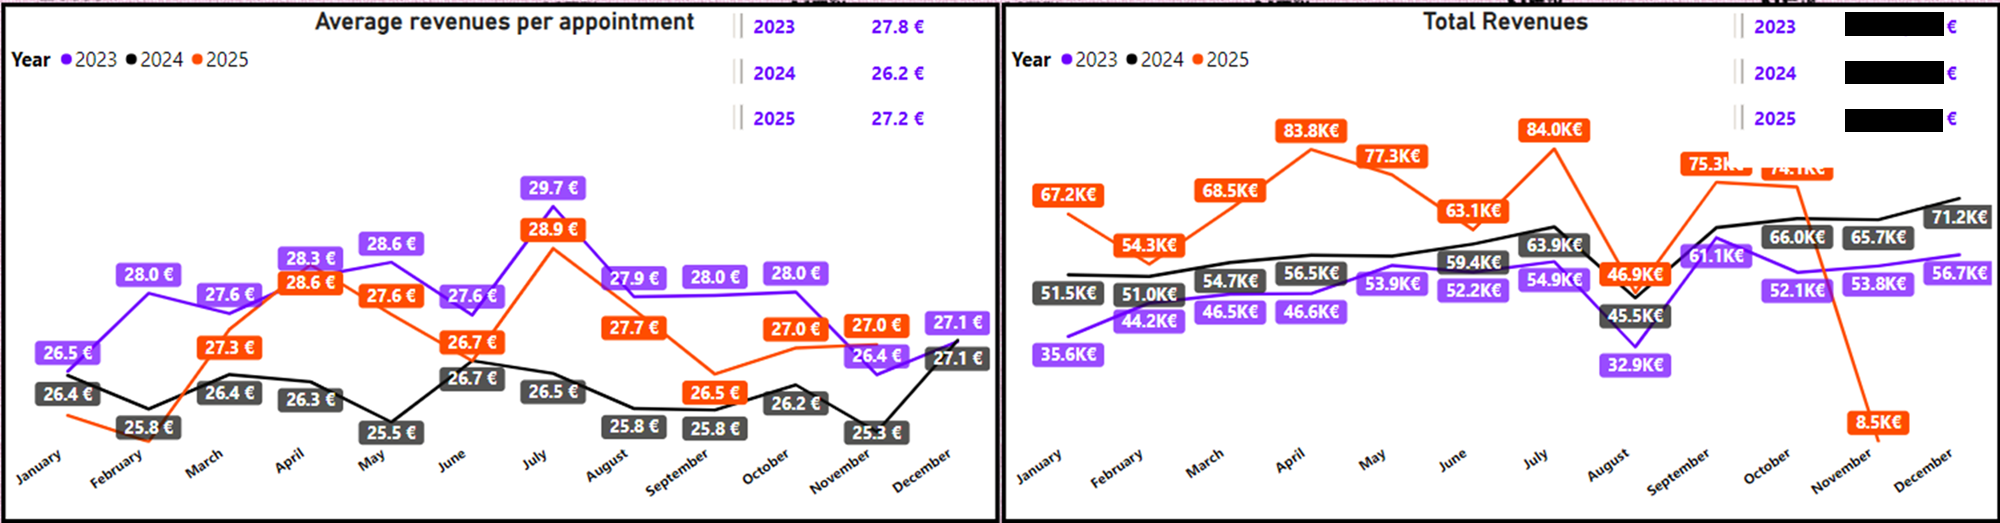
- Average and total revenues per appointment
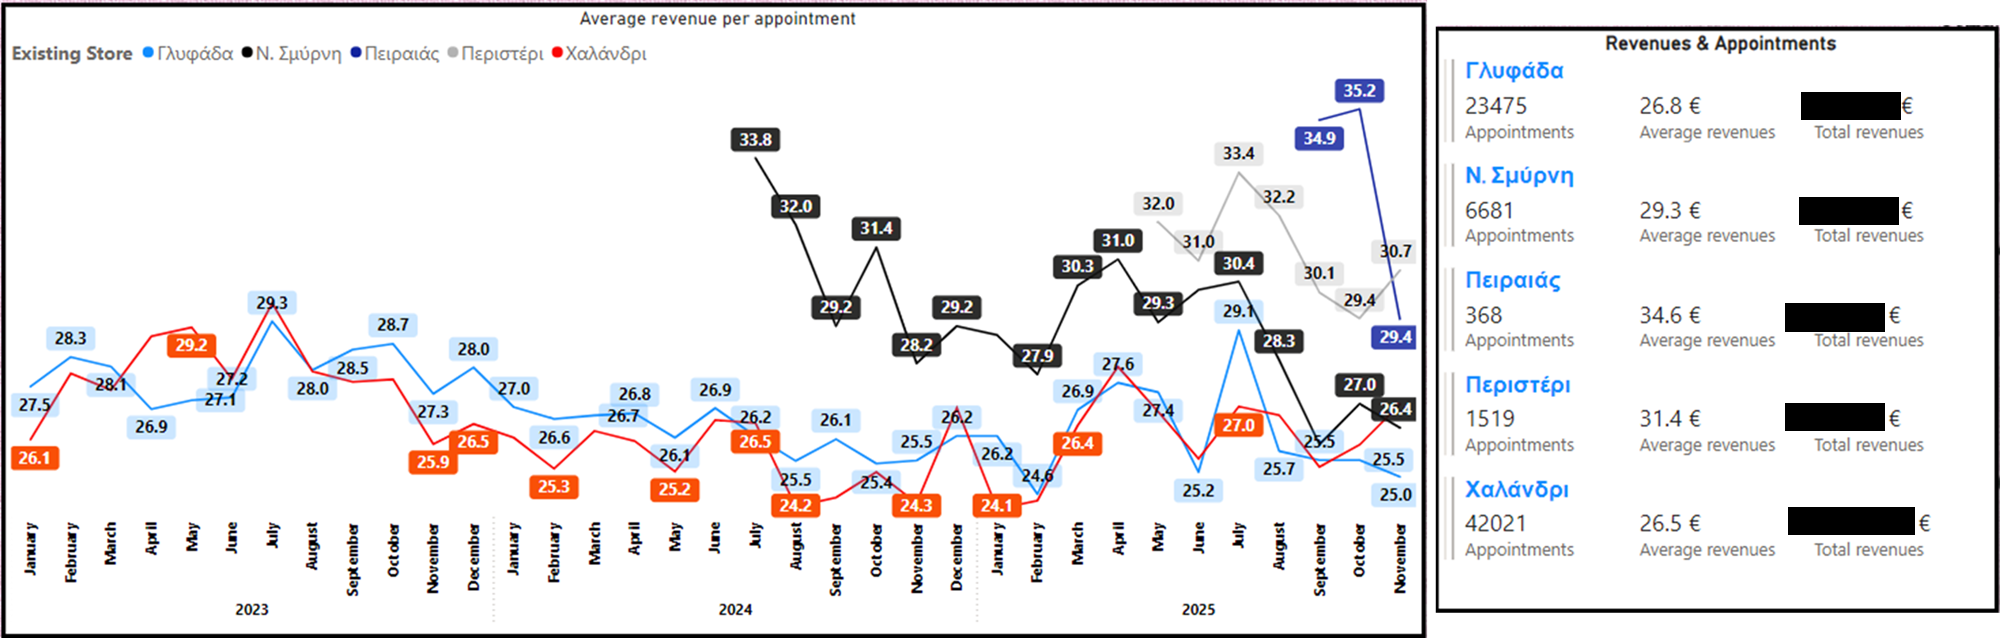
- Revenue per store — average per appointment and total
- Monthly revenue trends (avg & total)
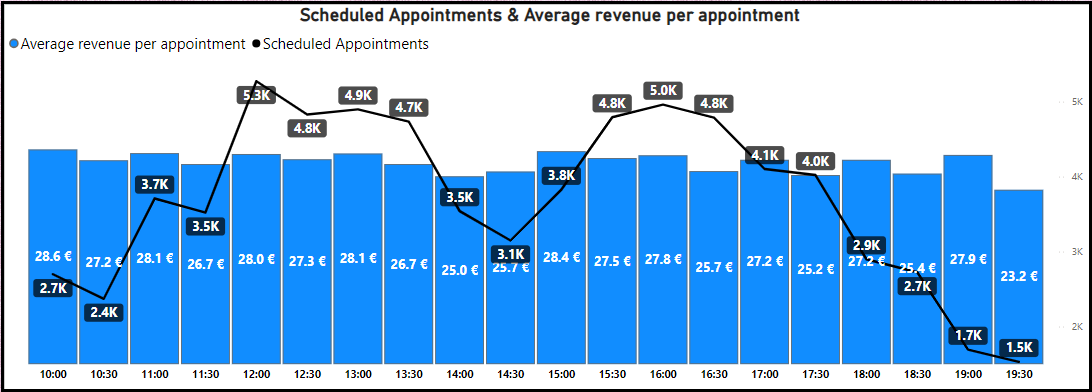
- Revenue per time interval
- Revenue per store and per month
- Revenue per weekday and interval
- Revenue per employee
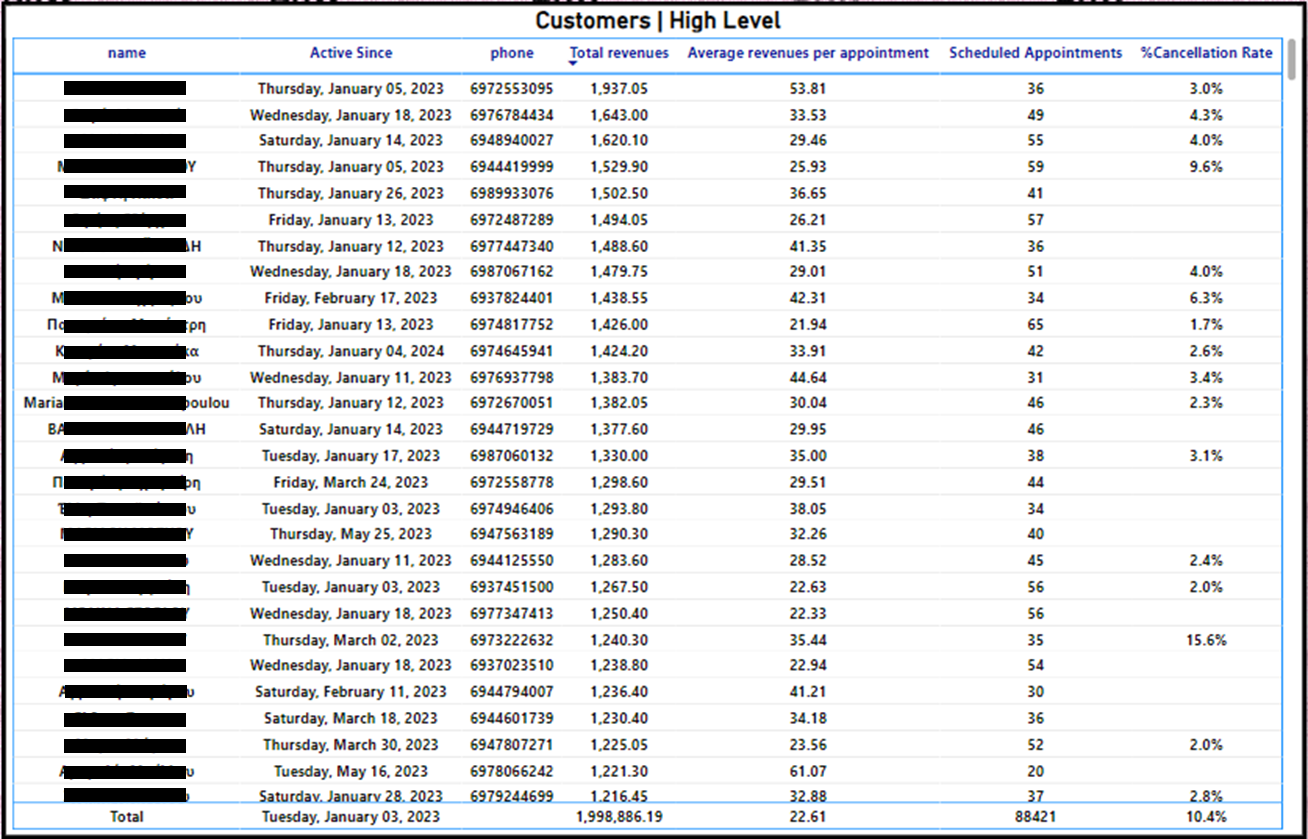
- Revenue per customer (total & avg)
Appointments Frequency
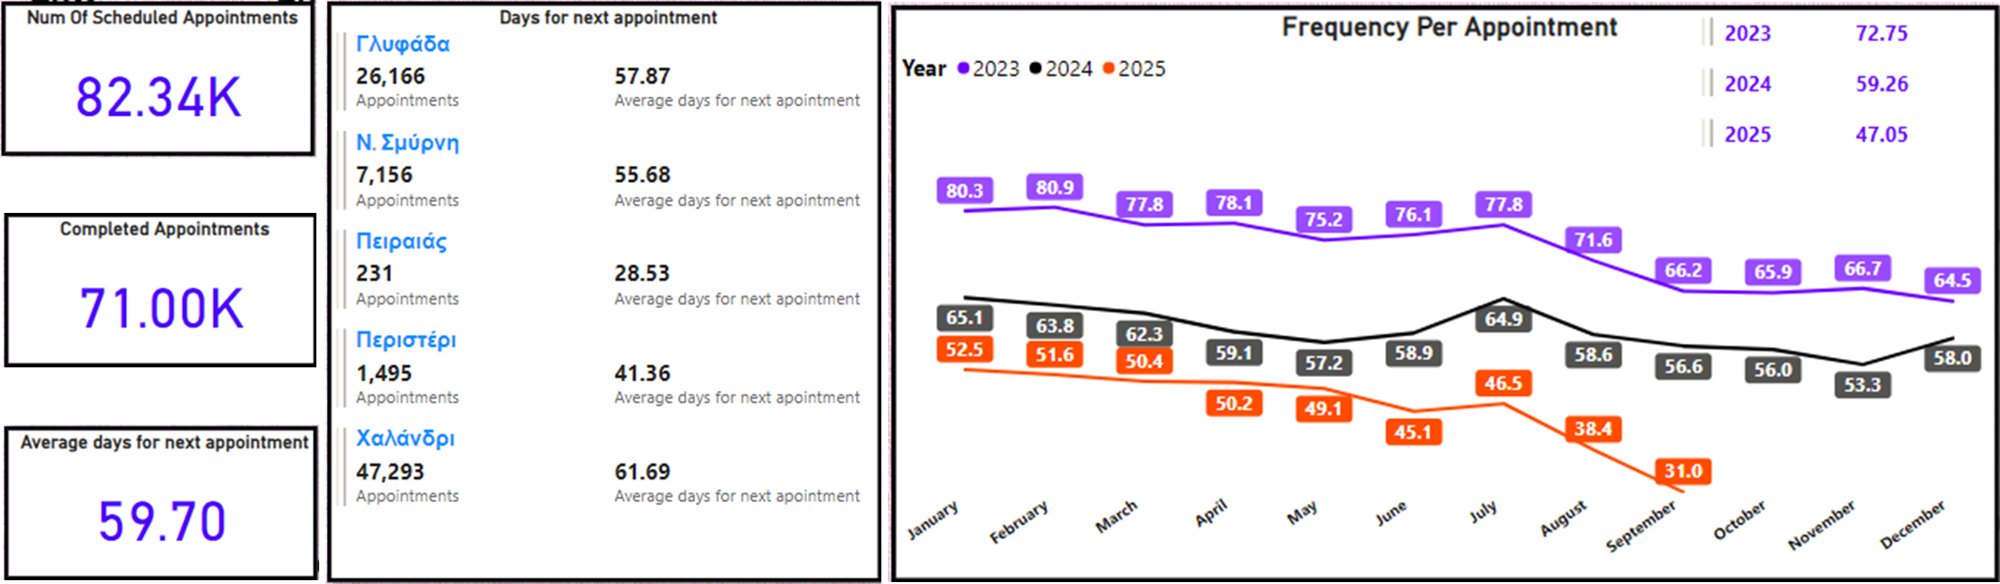
Measure how often your clients return and track trends over time across your stores.
- Average number of days between visits
- Average days between visits per store
- Monthly & annual trend of visit intervals
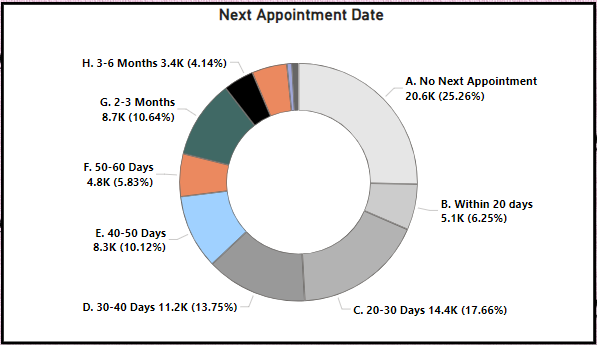
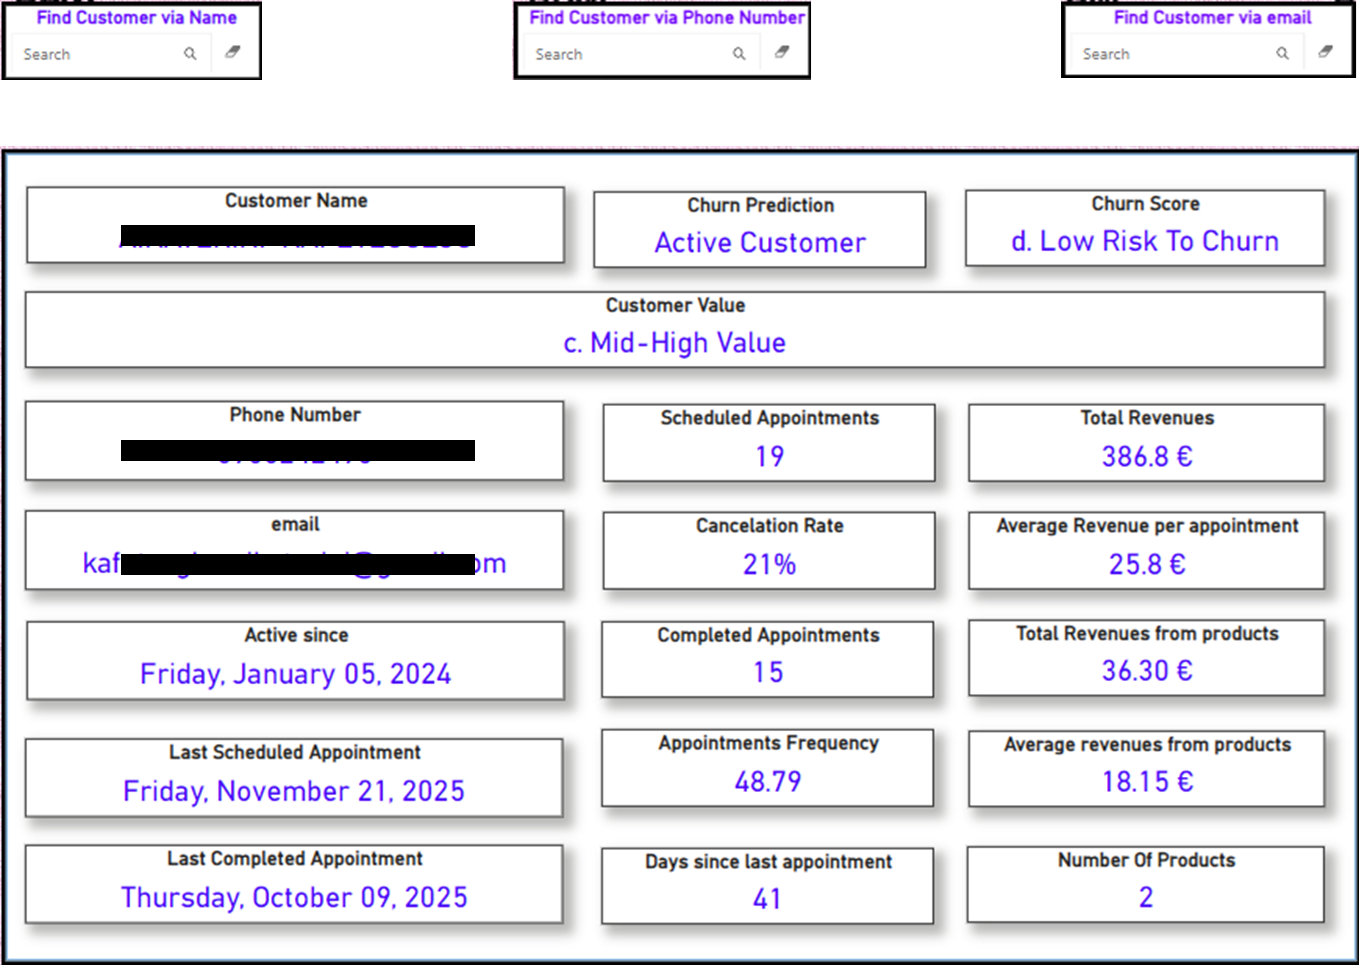
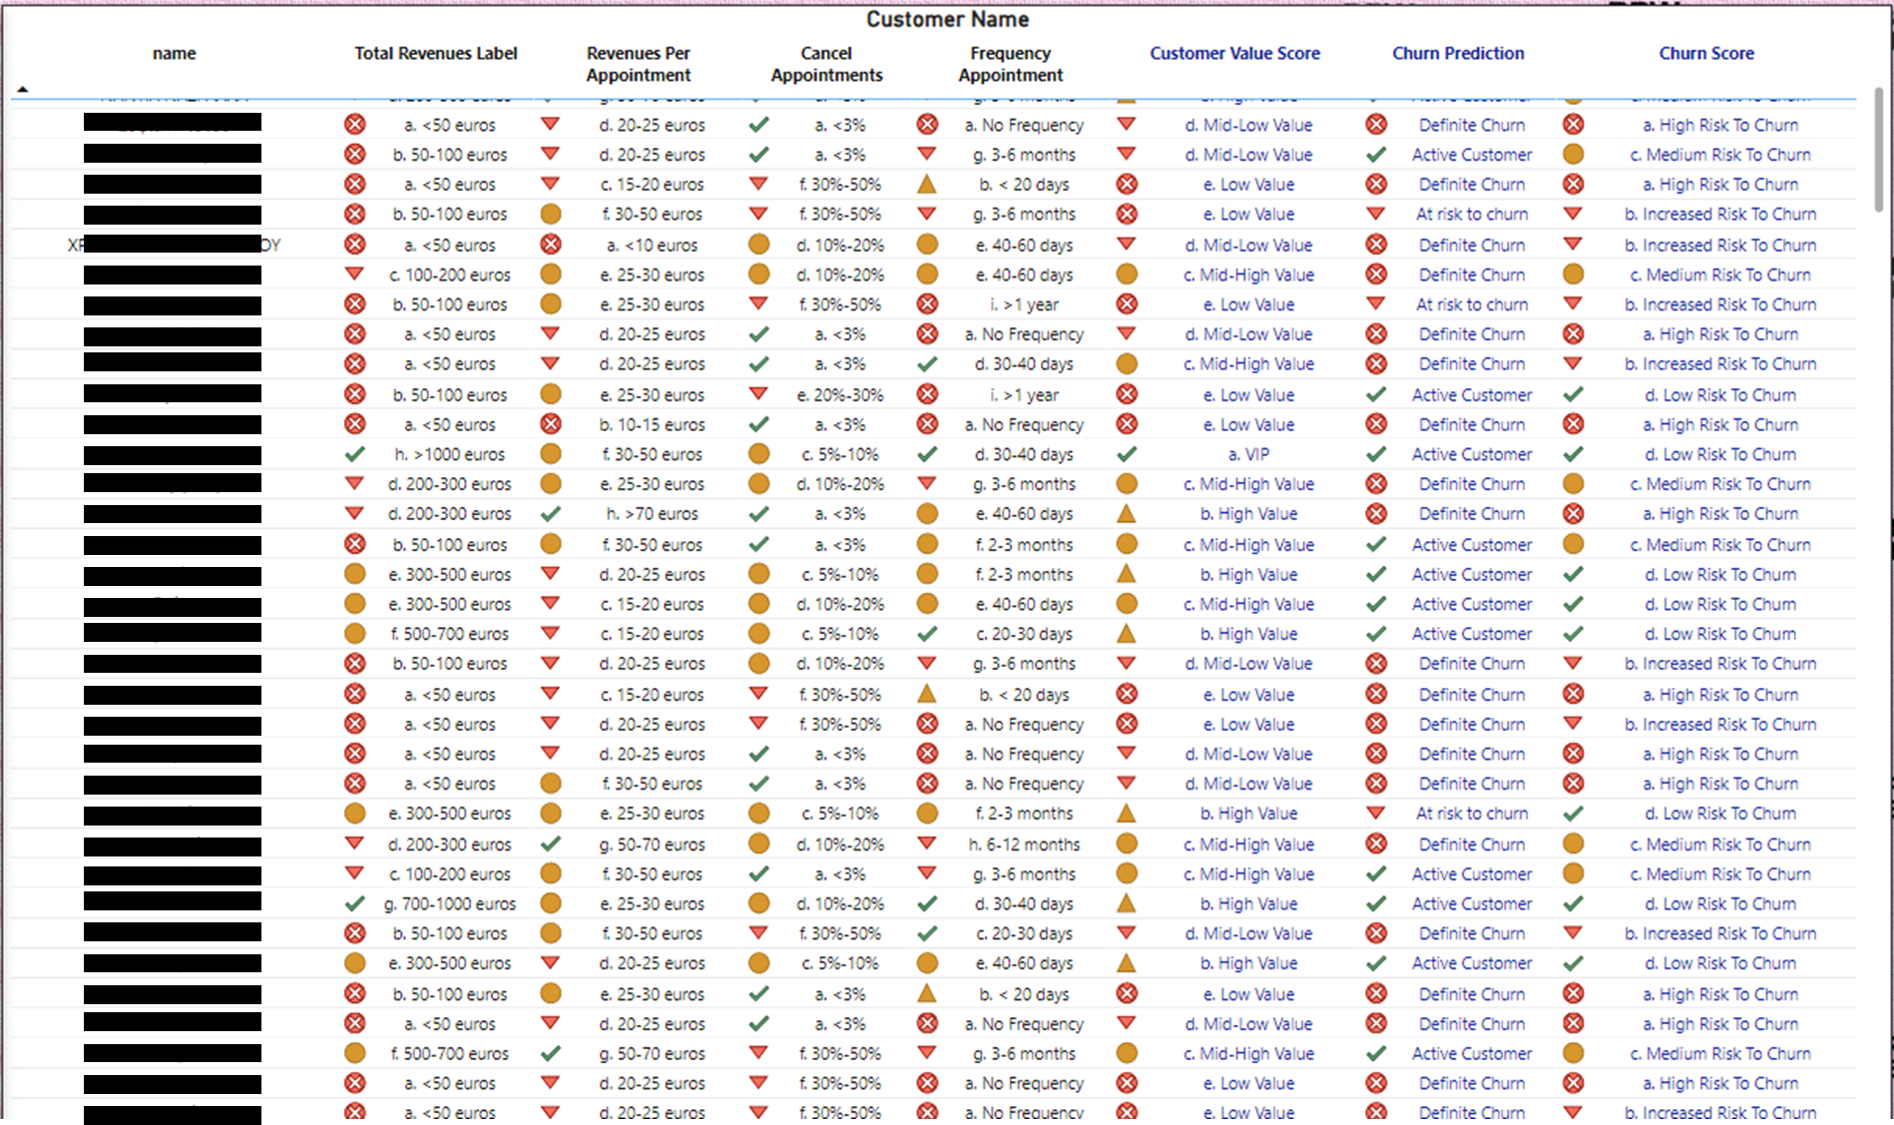
Comprehensive Customer Profile
Gain a 360° view of each customer—from appointment history and purchase behavior to cancellation risk and loyalty status.
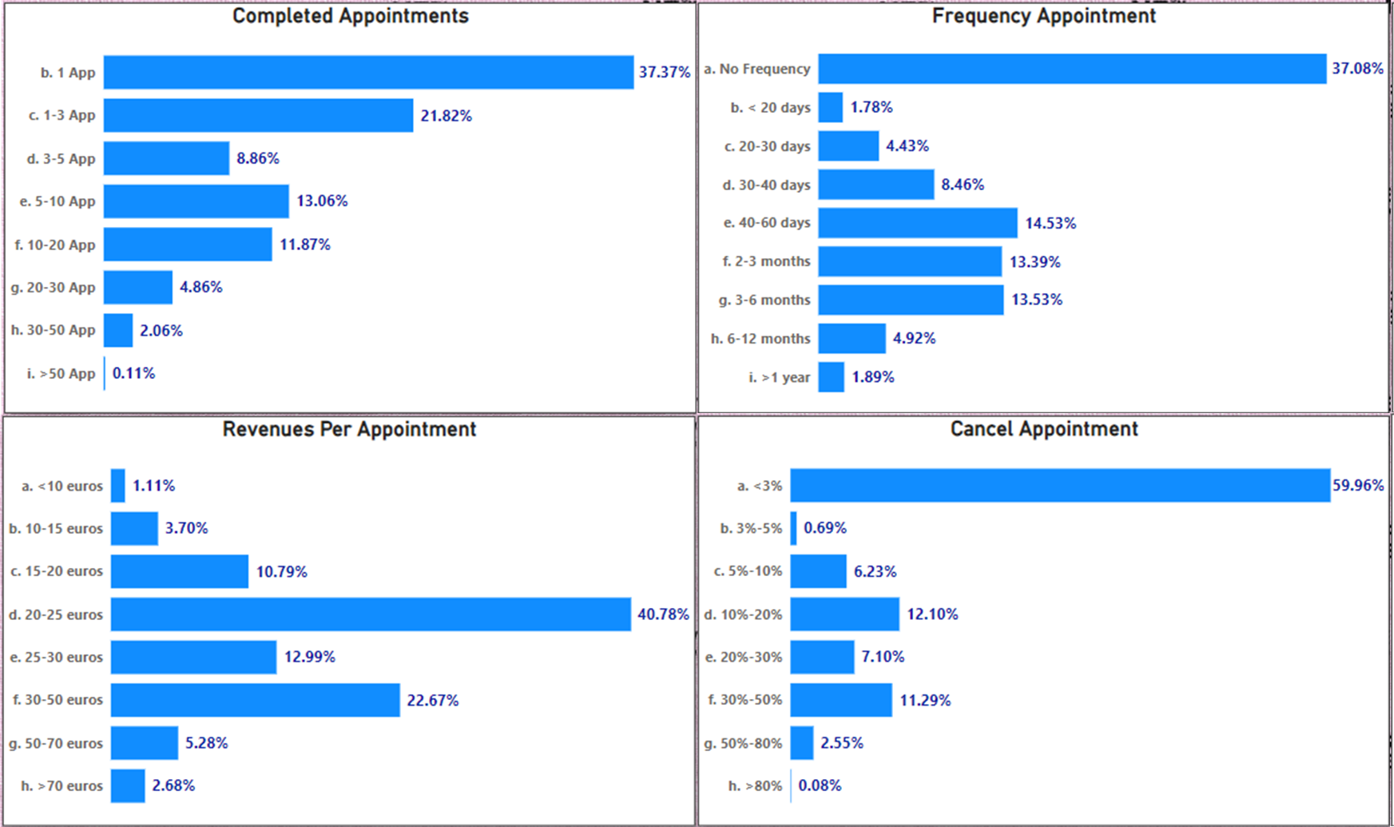
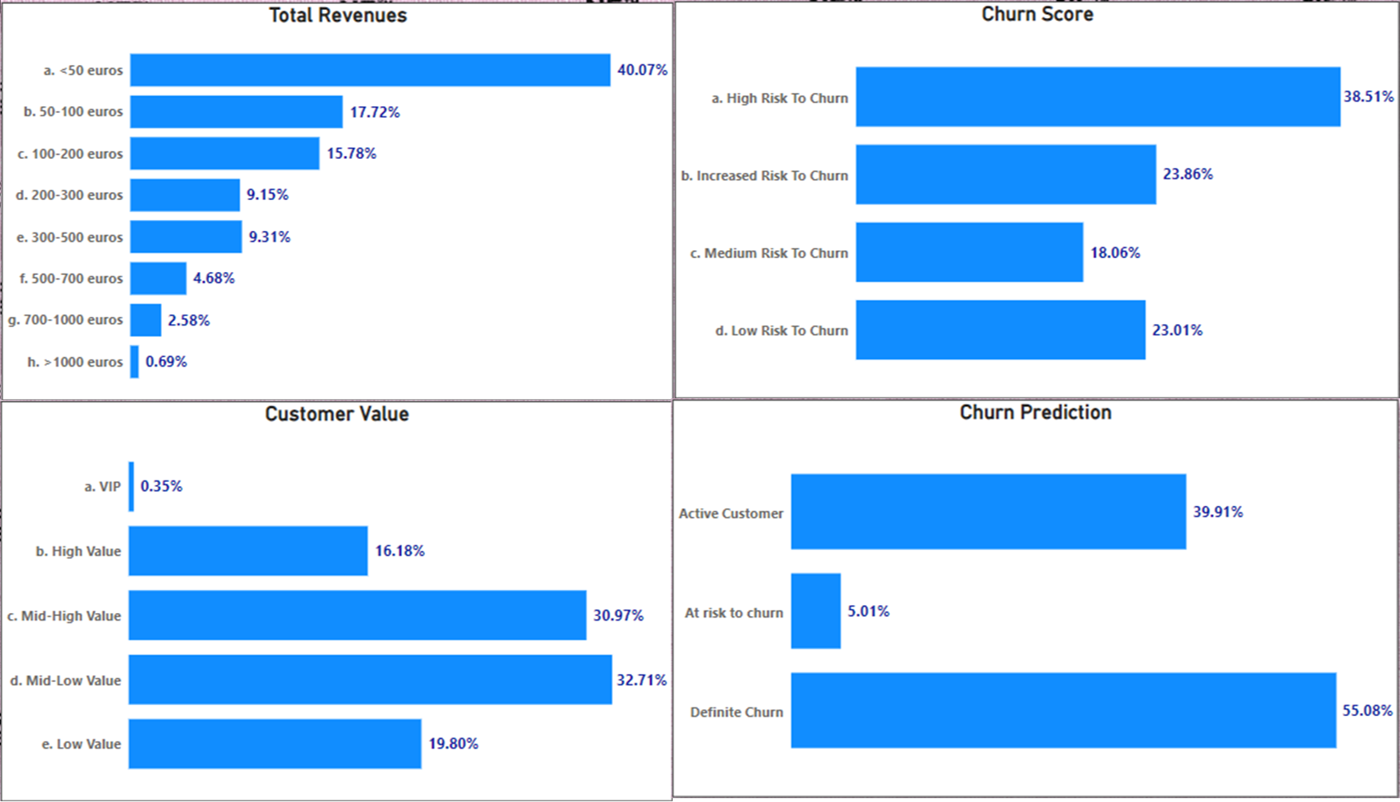
Company-wide Customer Insights
Segment your customer base with powerful grouping filters. Discover who drives revenue, who’s at risk, and how your audience behaves overall.
- Customer groups by number of appointments
- Customer groups by appointment frequency
- Customer groups by total revenues
- Customer groups by revenues per appointment
- Customer groups by cancellations
- Customer value segmentation
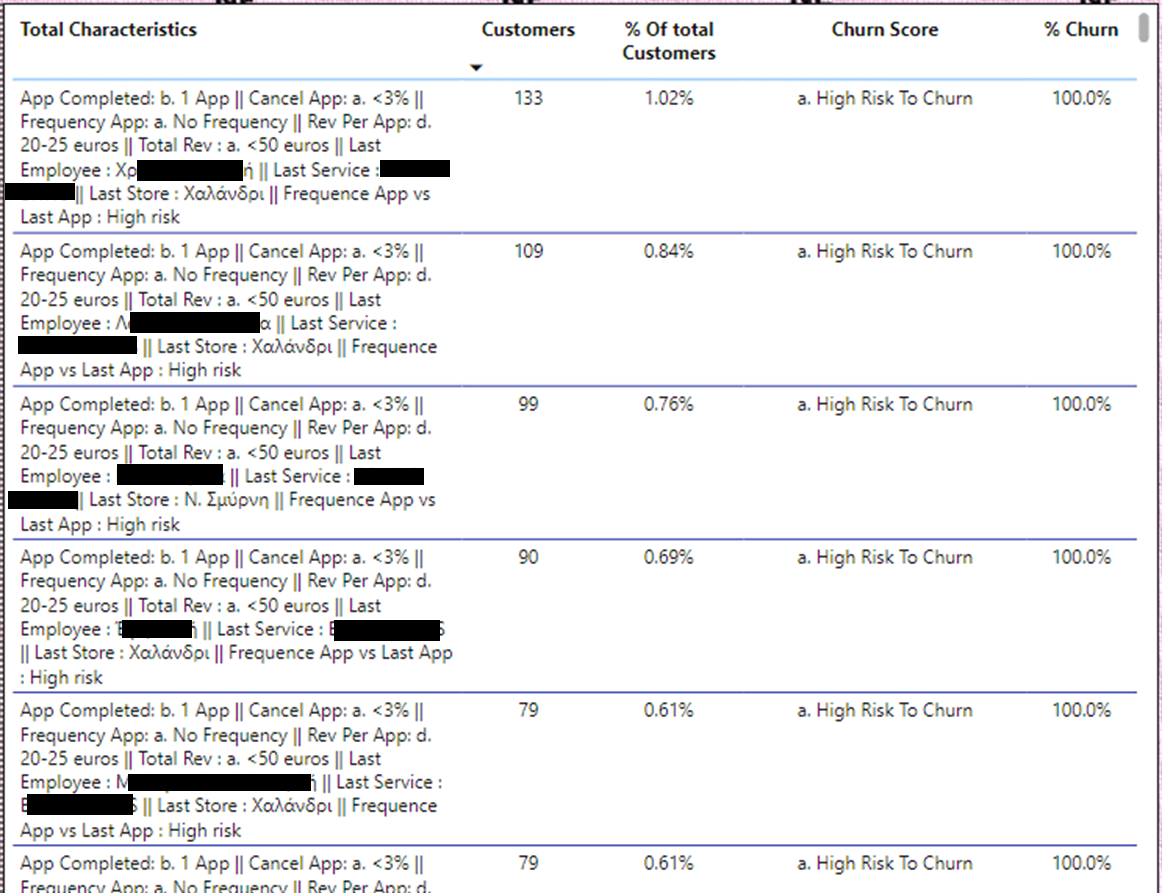
- Churn risk segmentation
Customer Base Rating
Get a clear picture of your entire customer base through scoring and evaluation models. Understand the quality and potential of each segment.
- Visual breakdown of customer segments by behavior, value, and engagement
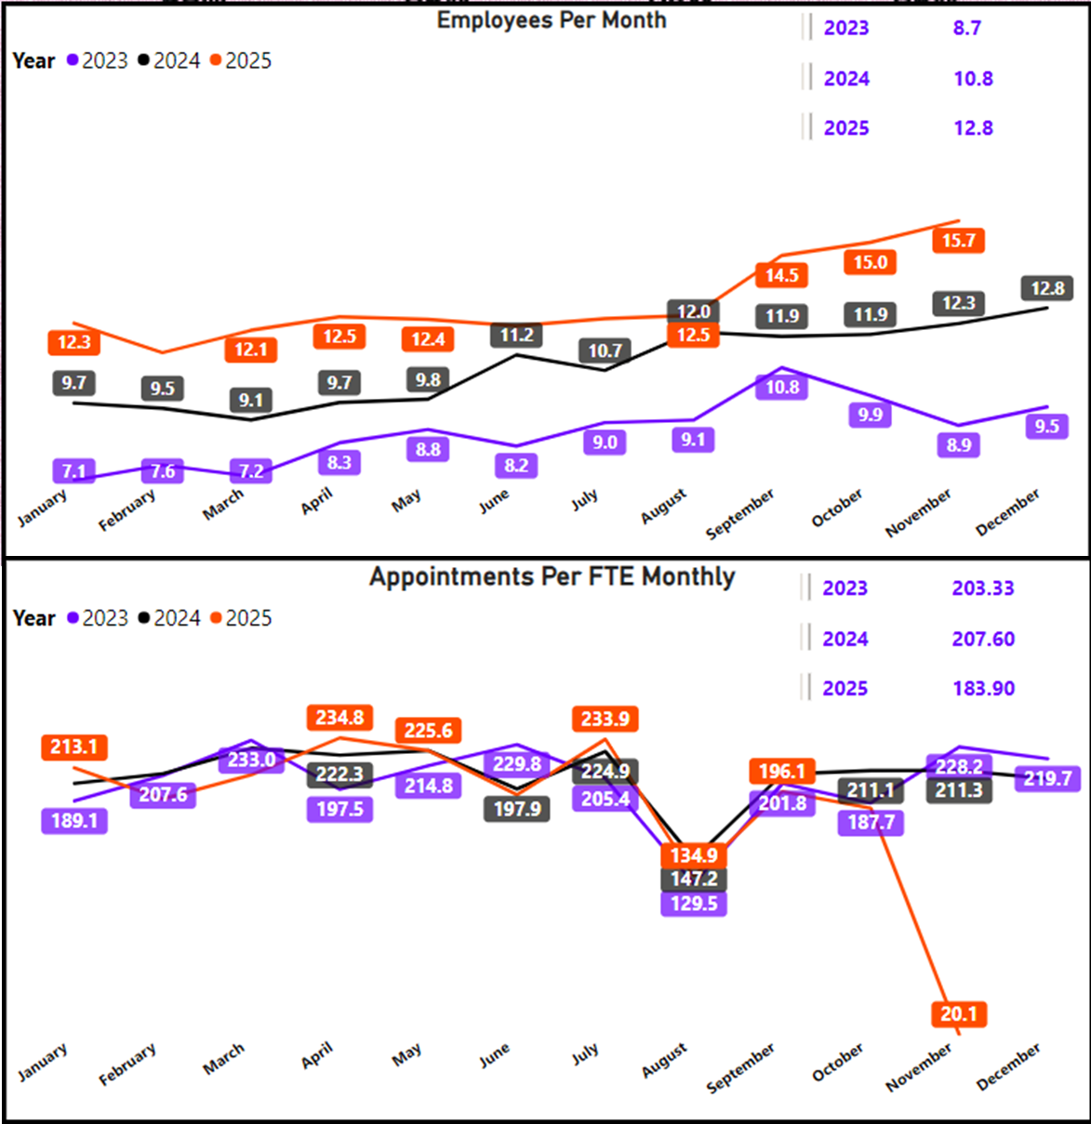
Employees Productivity
Monitor how each team member contributes to your success through appointment volume and revenue performance.
- Average number of employees per month and year
- Number of appointments per employee per month
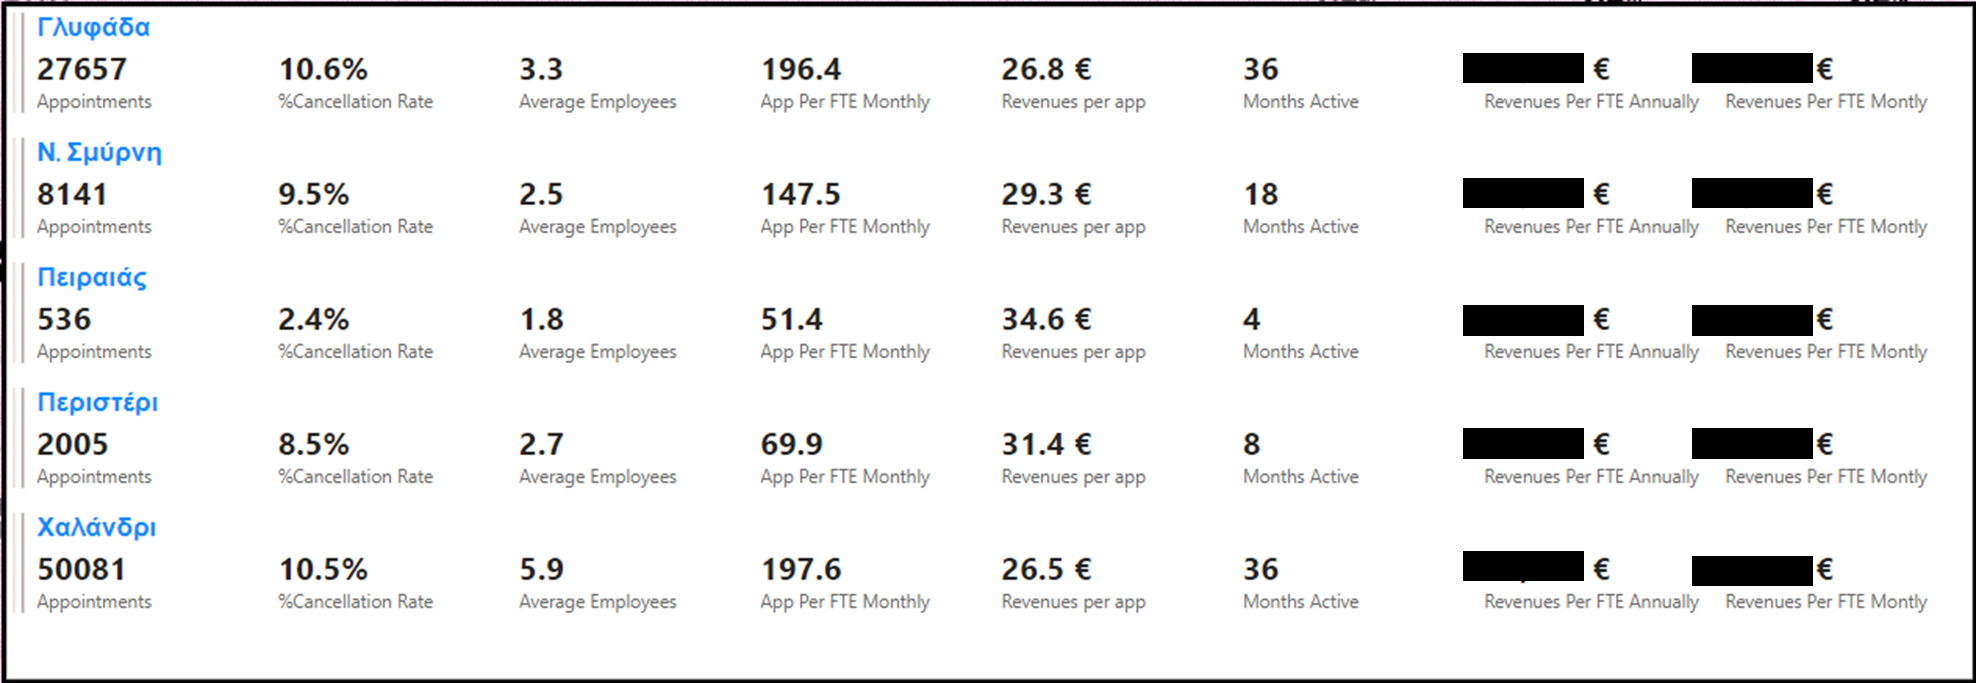
- Analysis of appointments & revenue per store and per employee
Store Appointment Flow & Results
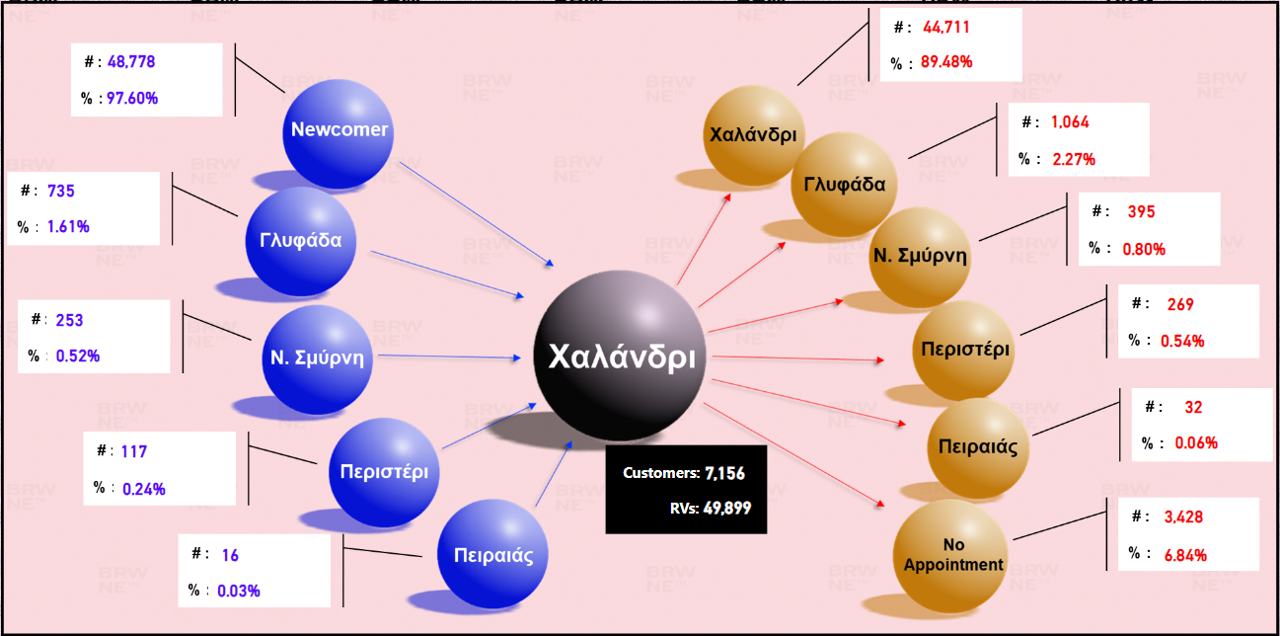
Understand how appointments move across stores and analyze post-visit behavior to improve retention.
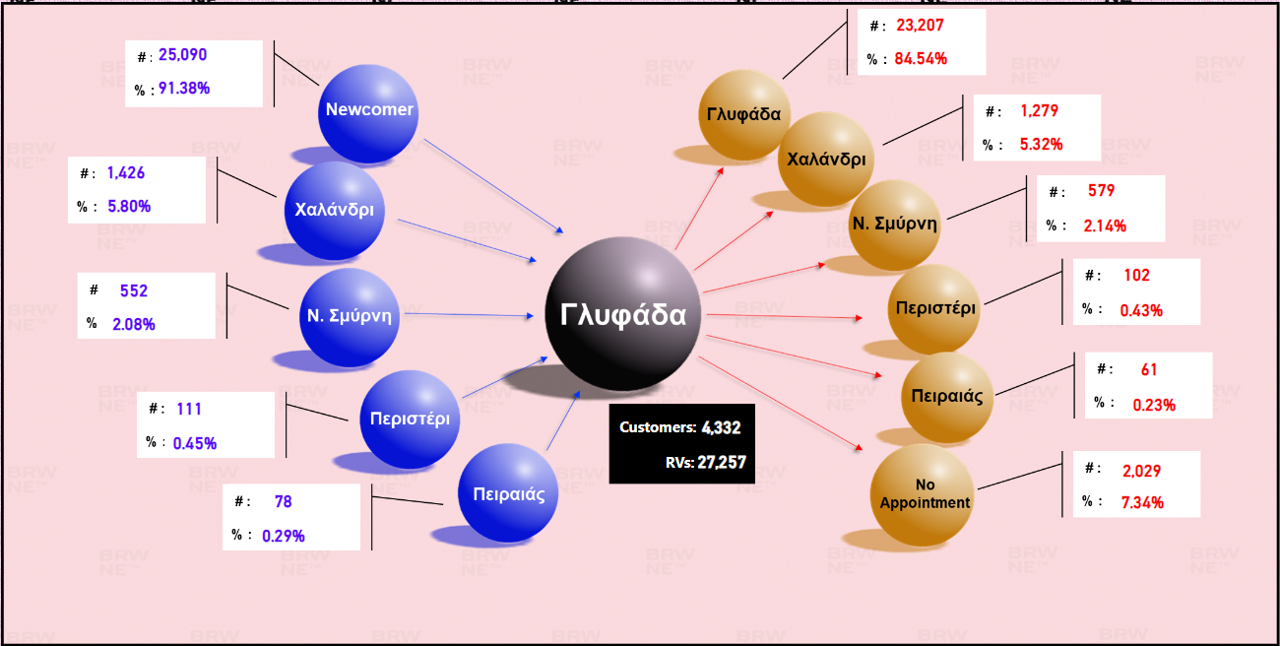
- Origin of appointments per store (new customers, referrals, transfers)
- Post-appointment behavior: same store revisit, other store revisit, no return
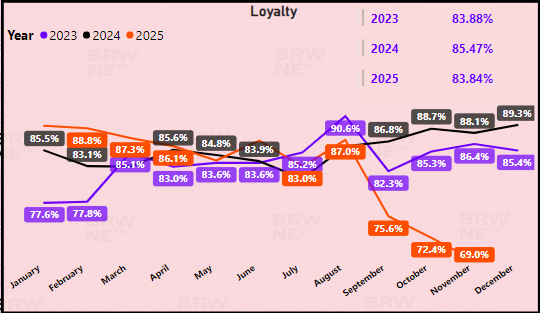
- Store loyalty: % of customers revisiting the same store
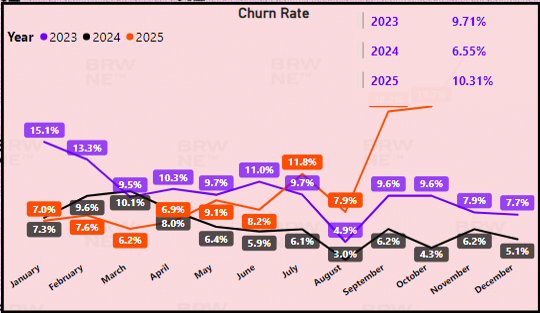
- Churn rate: customers who never visited again
Product Sales Performance
Track product sales trends, revenue contribution, and staff performance in upselling.
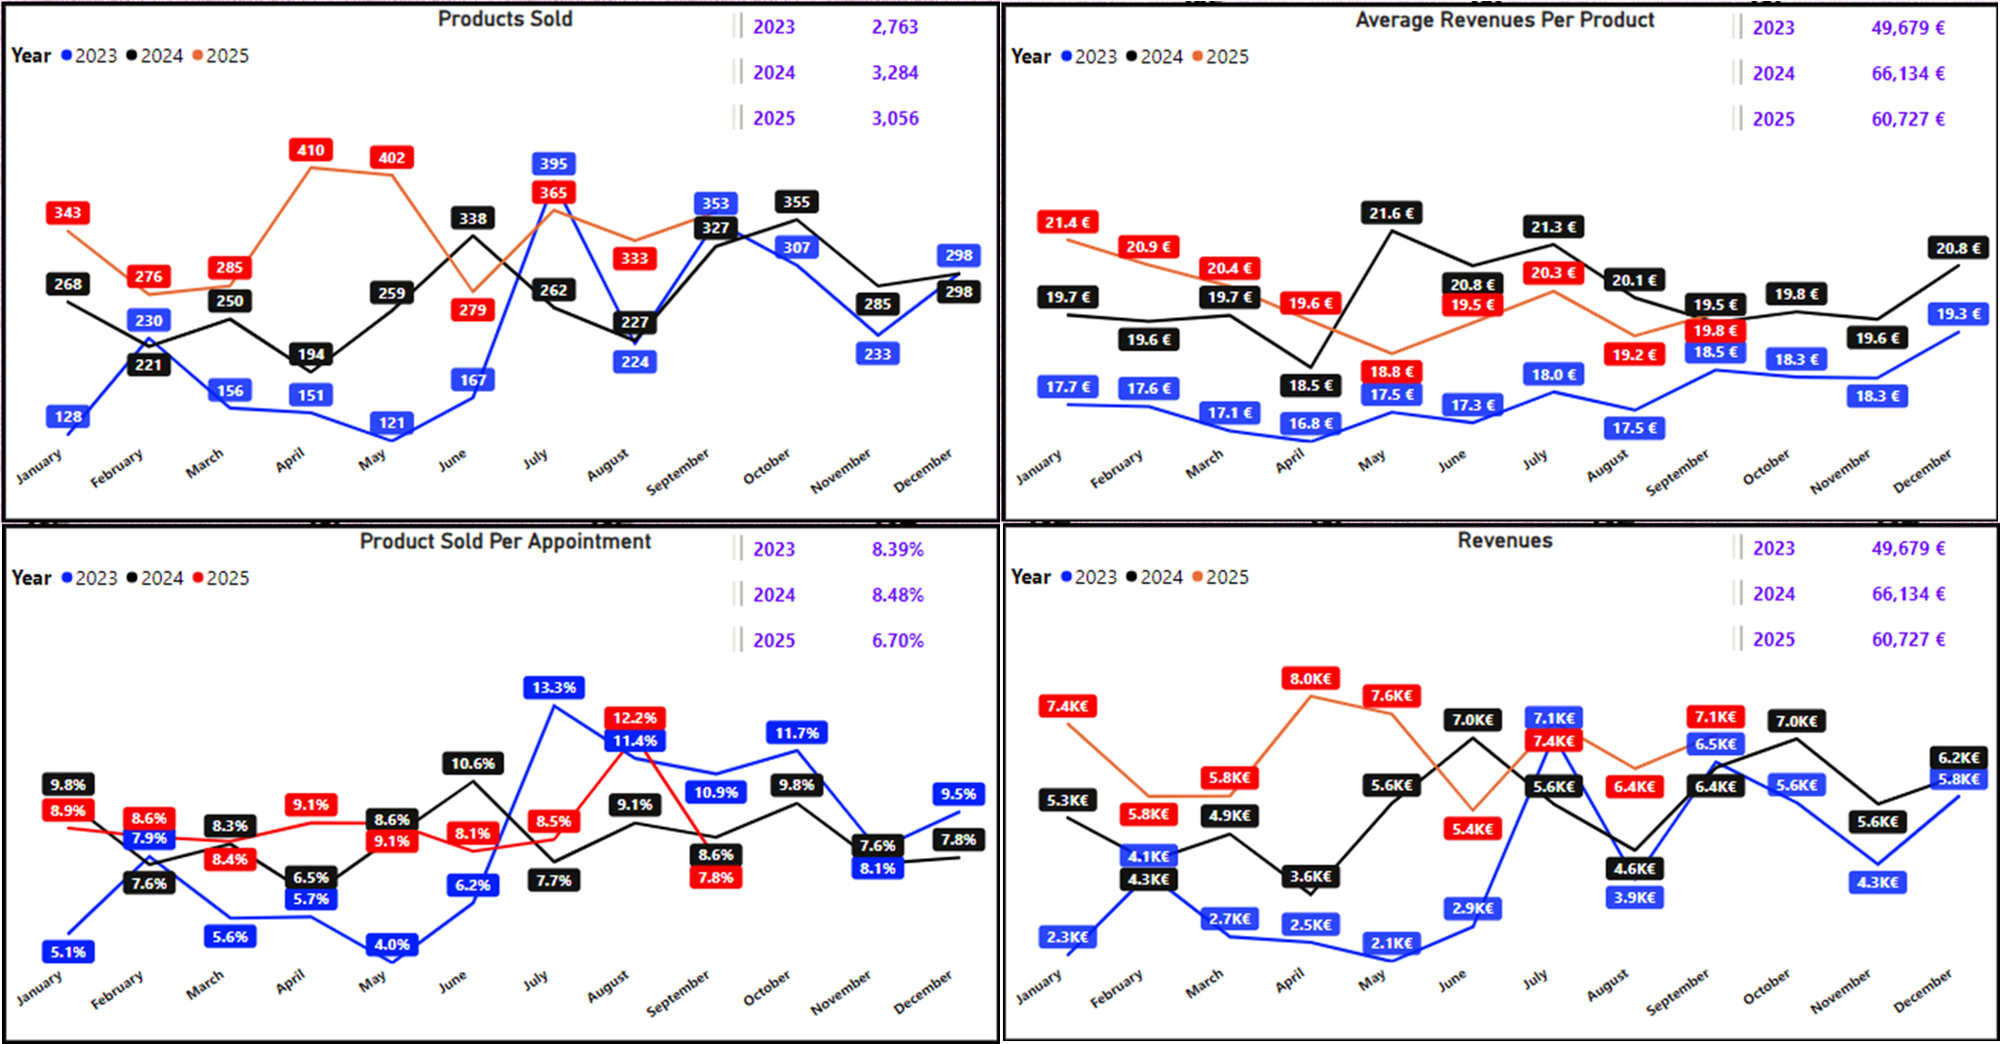
- Number of products sold per month and annually
- Average revenue per product and total product revenues
- Percentage of appointments ending in product sale (monthly & annually)
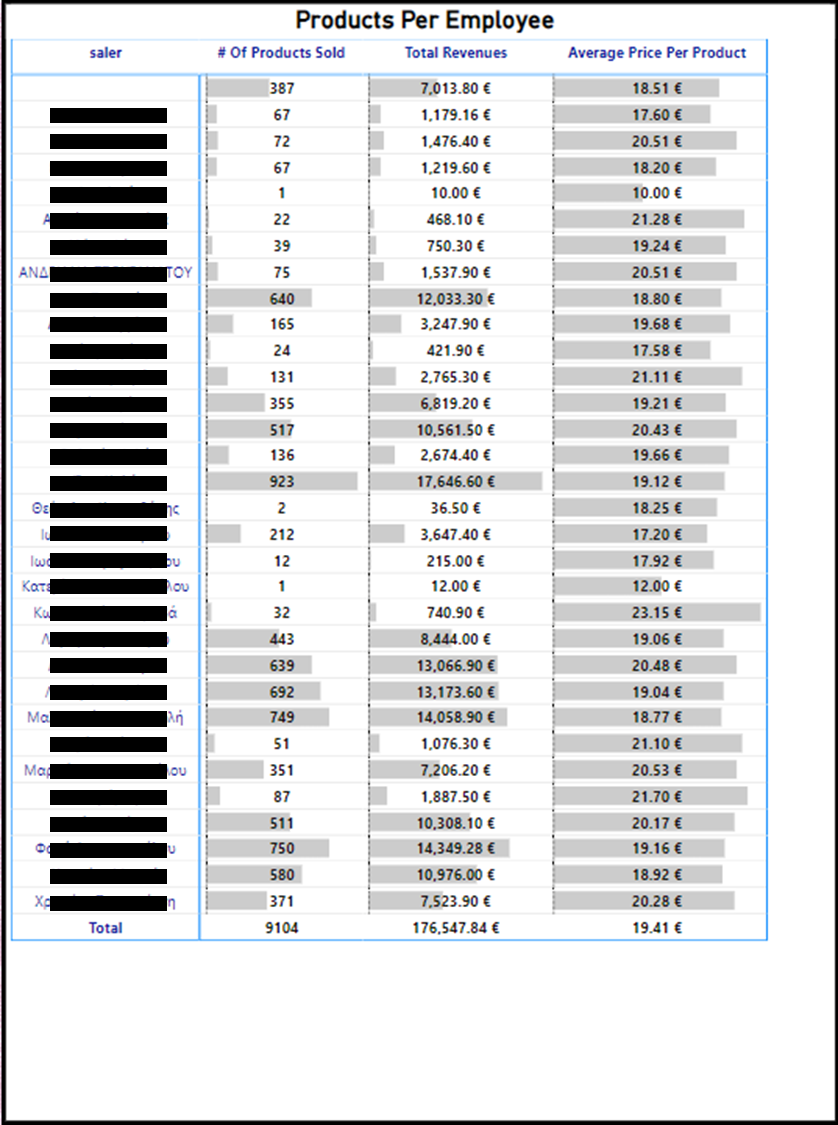
- Product sales analysis per employee and customer
Churn Prediction
Leverage advanced analytics to predict which customers are most likely to leave, and identify actionable drivers behind the risk.
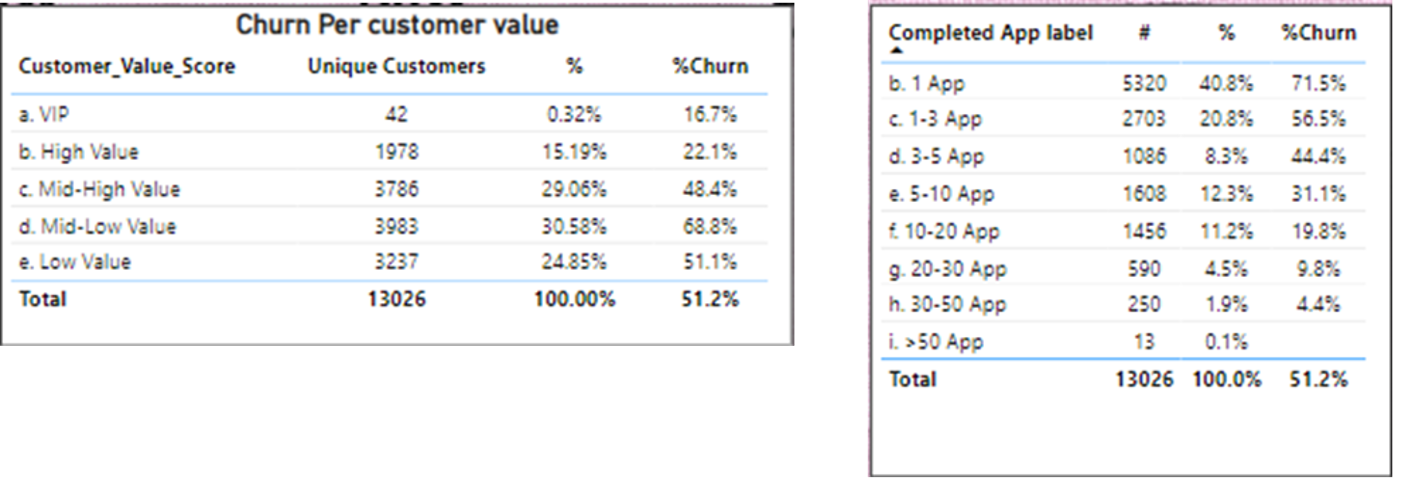
- Churn rate by customer value
- Churn by number of appointments
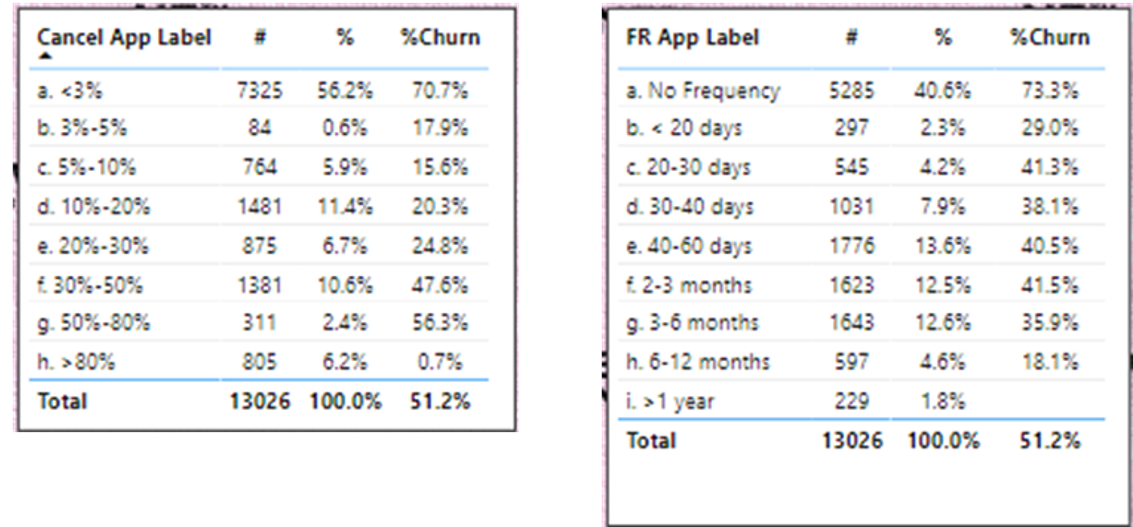
- Churn by percentage of cancelled appointments
- Churn by appointment frequency
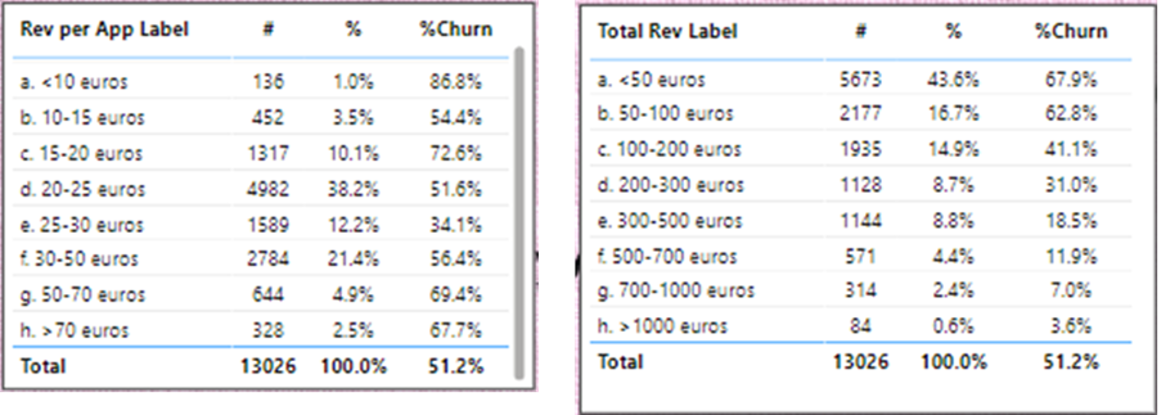
- Churn by average revenue per appointment
- Churn by total revenues
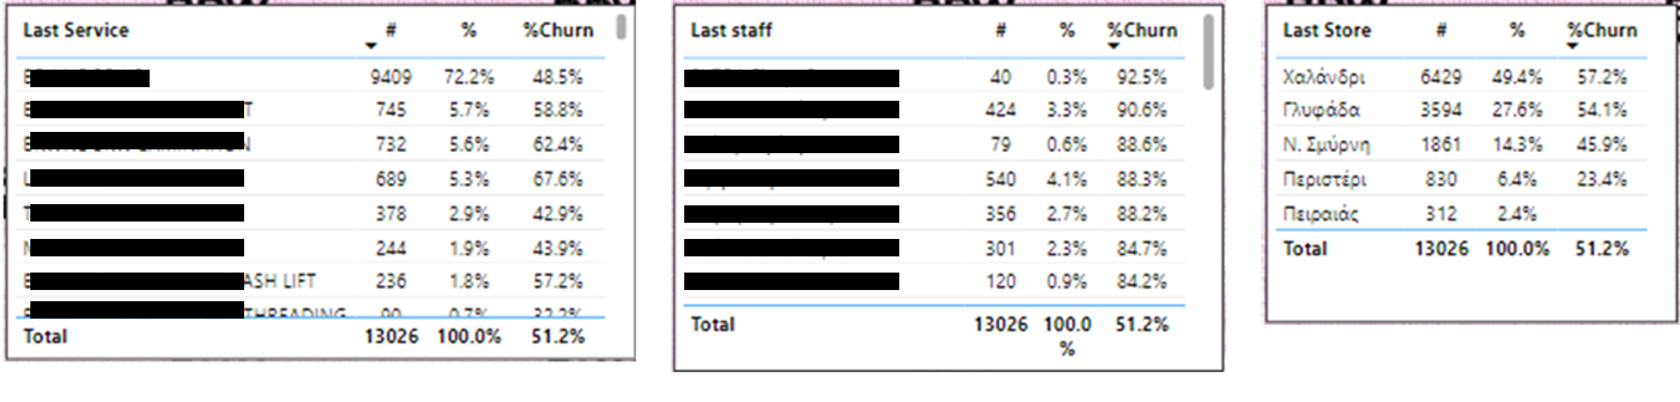
- Churn by last service received
- Churn by last employee who served
- Churn by last store visited
- Customer journey patterns and churn risk per pattern